Investing Newsletter 8.23
July 2023 Economic & Policy Update
The economy
The jobs market remained hot and the economy on stable footing while inflation cooled further in July.
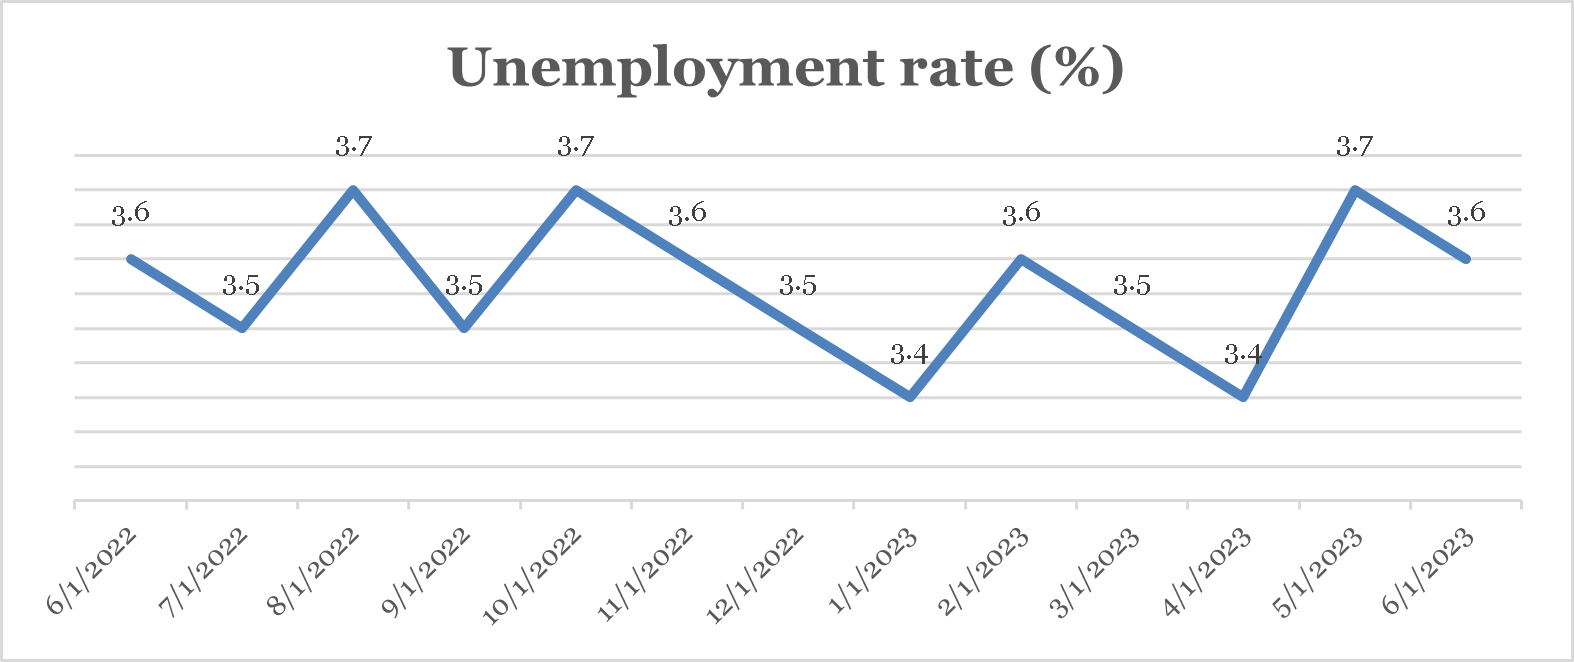
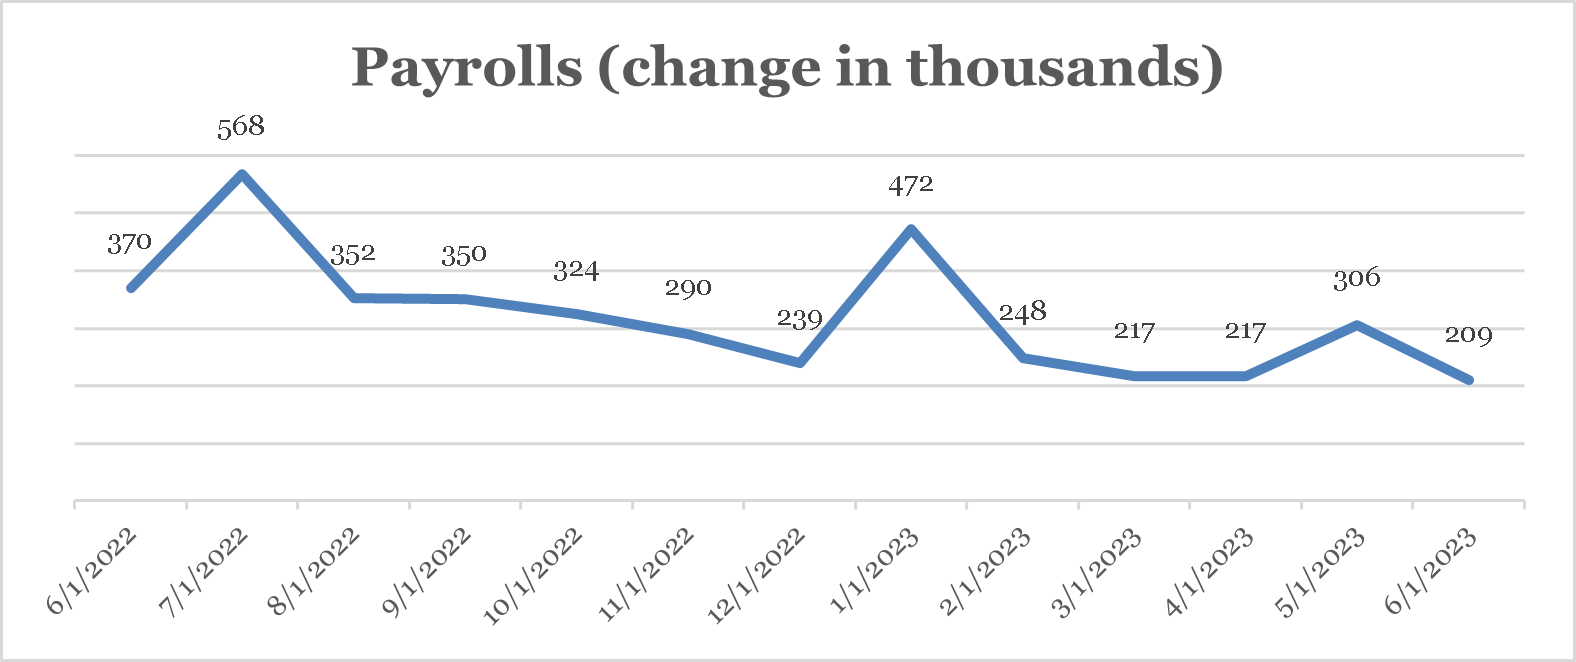
Unemployment fell to 3.6 percent in July, a 0.1 percentage point decline from June, while new jobs (payrolls) dropped to 185,000 from a downwardly revised 306,000 the month before. [1] Despite the fall in payrolls, job creation remains strong: as a percentage of the labor force, new jobs are at historically typical levels.
Source: St. Louis Federal Reserve
CLICK ON CHART TO VIEW LARGER IMAGE
Monthly job-market indicators are generally considered “lagging,” they tell us about the state of the economy three-or-so months ago. More frequent labor-market indicators measures, such as weekly first-time unemployment claims, are considered “leading”: they tell us where the economy might be headed. And first-time claims fell every week but one in July, starting the month at 249,000 and ending it at 221,000. This would suggest continued labor market strength.
In a similarly optimistic vein, economic growth was strong in the April-to-June quarter: real gross domestic product (GDP) grew by an estimated 2.4 percent (annualized) in that second quarter, an increase from the first quarter’s 2.0 percent growth rate. This was the fourth-straight quarter of economic growth. In the last year, GDP has increased by about 2.6 percent, above reasonable estimates of “potential” growth using economic fundamentals. So not only is the economy growing, but it’s growing briskly. To anyone following the bounce in housing—the direct and indirect effects of which trickle diffuse through the economy in the form of more spending— this shouldn’t come as surprise. The Case-Shiller National Home Price index rose roughly 1.2 percent, month-over-month (m/m) in the most recent data for the month of May, its fourth straight monthly gain following a string of losses dating back to July 2022. These monthly gains bring the index back to within about a percent of its all-time high (reached in 2022).
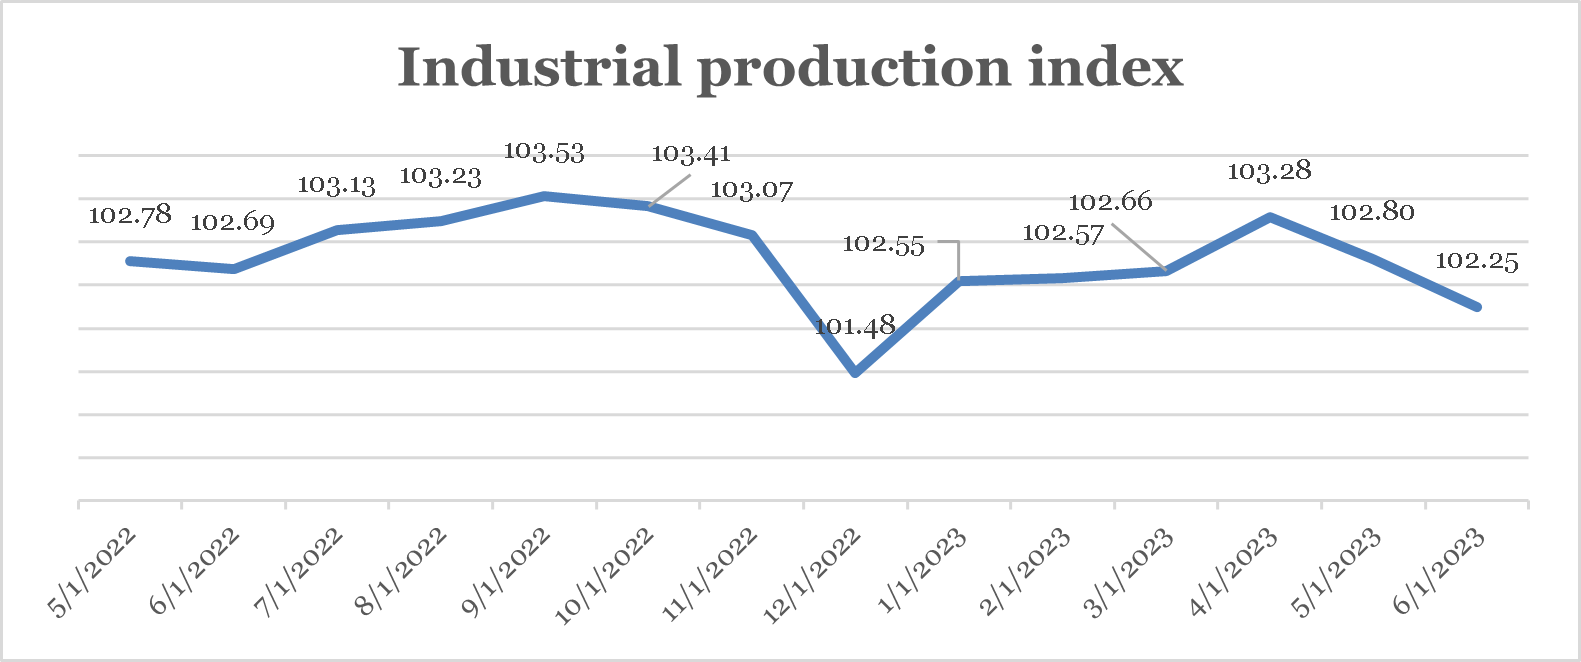
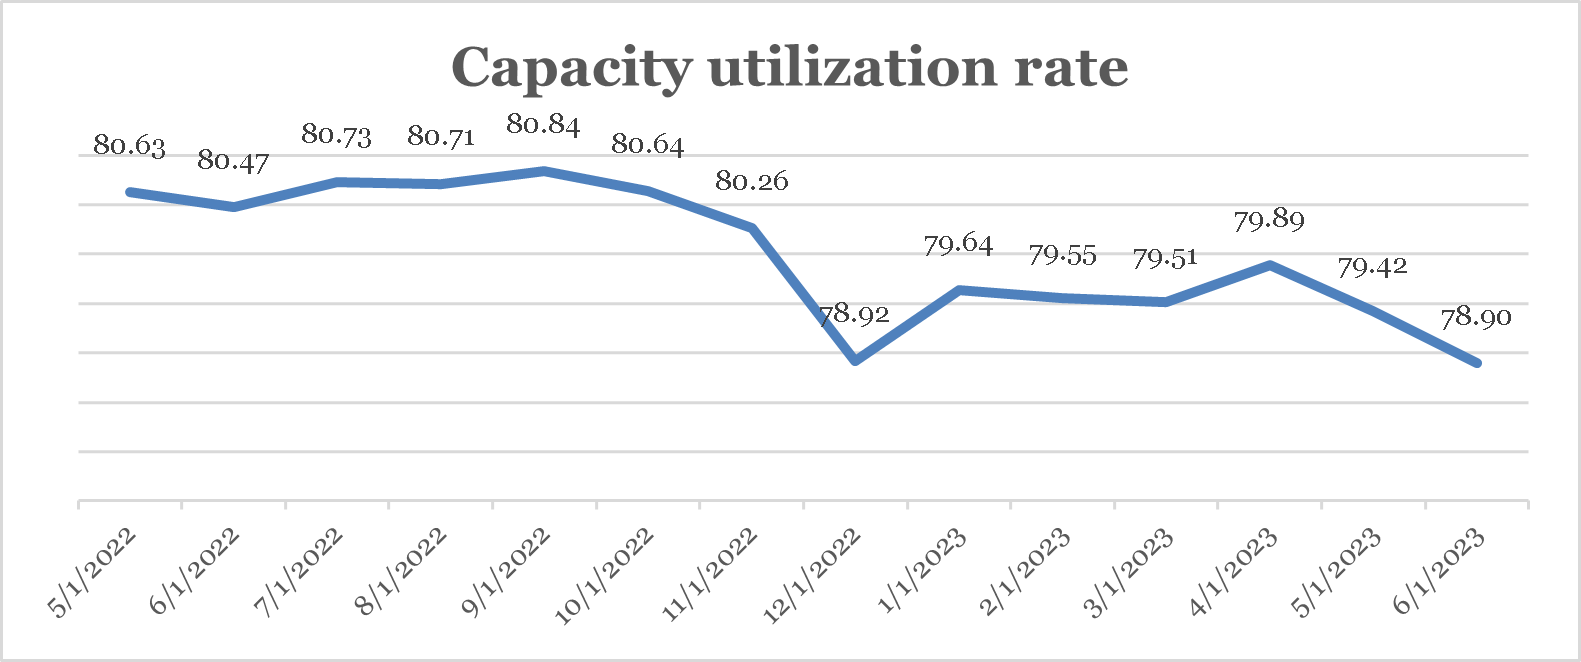
Other, potentially more current measures of economic performance—most of second quarter GDP growth happened before June—were more mixed in July. Industrial production and capacity utilization measure output in manufacturing. Unlike monthly labor market measures, industrial production and capacity utilization are considered “coincident” indicators: they tell us what’s happening in the economy now. And both fell in July for the second straight month.
Source: St. Louis Federal Reserve
CLICK ON CHART TO VIEW LARGER IMAGE
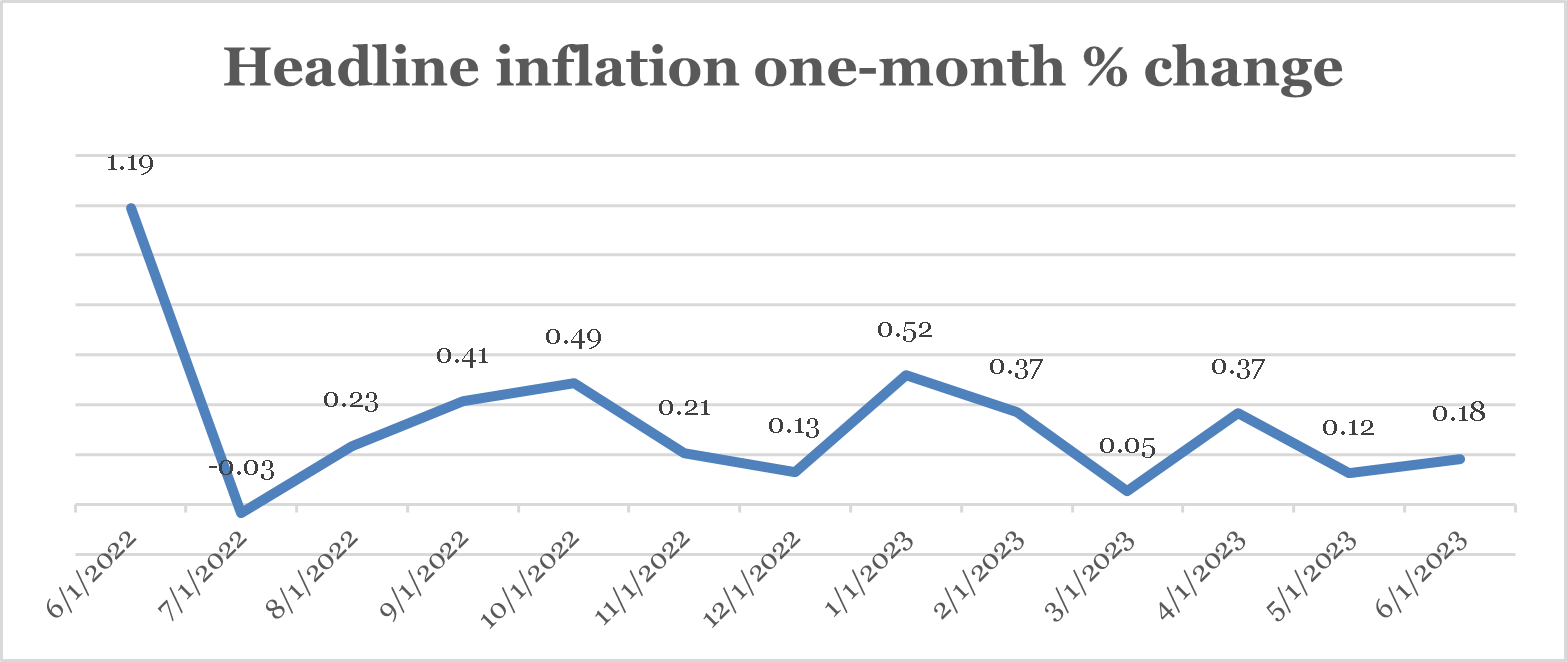
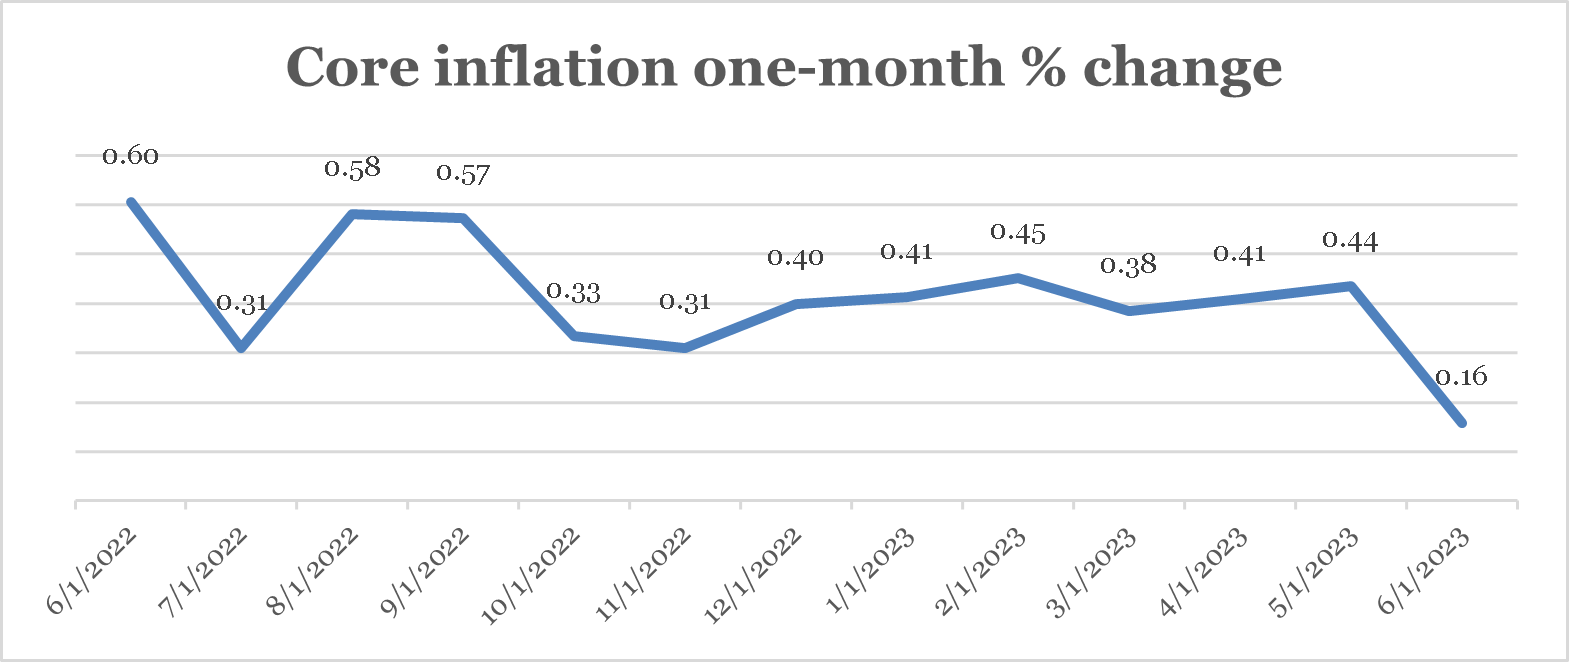
If the economy did indeed slow last month, as industrial production and capacity utilization suggest, that may partly explain easing inflation pressure. The change in “headline” (all goods and services) inflation was 0.2 percent in June, m/m, according to the consumer price index (CPI). Core CPI inflation, which removes erratic food and energy price changes to isolate the trend in inflation, changed by the same amount. Both figures are significantly lower than year-ago monthly changes.
Source: St. Louis Federal Reserve
CLICK ON CHART TO VIEW LARGER IMAGE
This slowing rate of price increases brought year-over-year changes down, too: headline inflation increased 3.1 percent in the 12-months ending June 30, the lowest since early 2021, and core inflation increased 4.9 percent. Confirming the deceleration in prices, the Federal Reserve’s (Fed’s) preferred inflation measure, the personal consumption expenditures “deflator” (PCE) rose 0.2 percent m/m in June, while core (ex. food and energy PCE) rose by the same amount. Year-over-year (y/y), headline PCE has risen 3 percent, or 1 percentage point higher than the Fed’s long-term goal but a big decline from the 7 percent y/y peak rate of headline PCE in 2022.
With economic growth steady through June and inflation easing, investors were inclined to look past the possibility of a growth slowdown and pushed riskier assets in July.
Economic policy
The Fed raised its policy rate again in July to further reduce inflation.
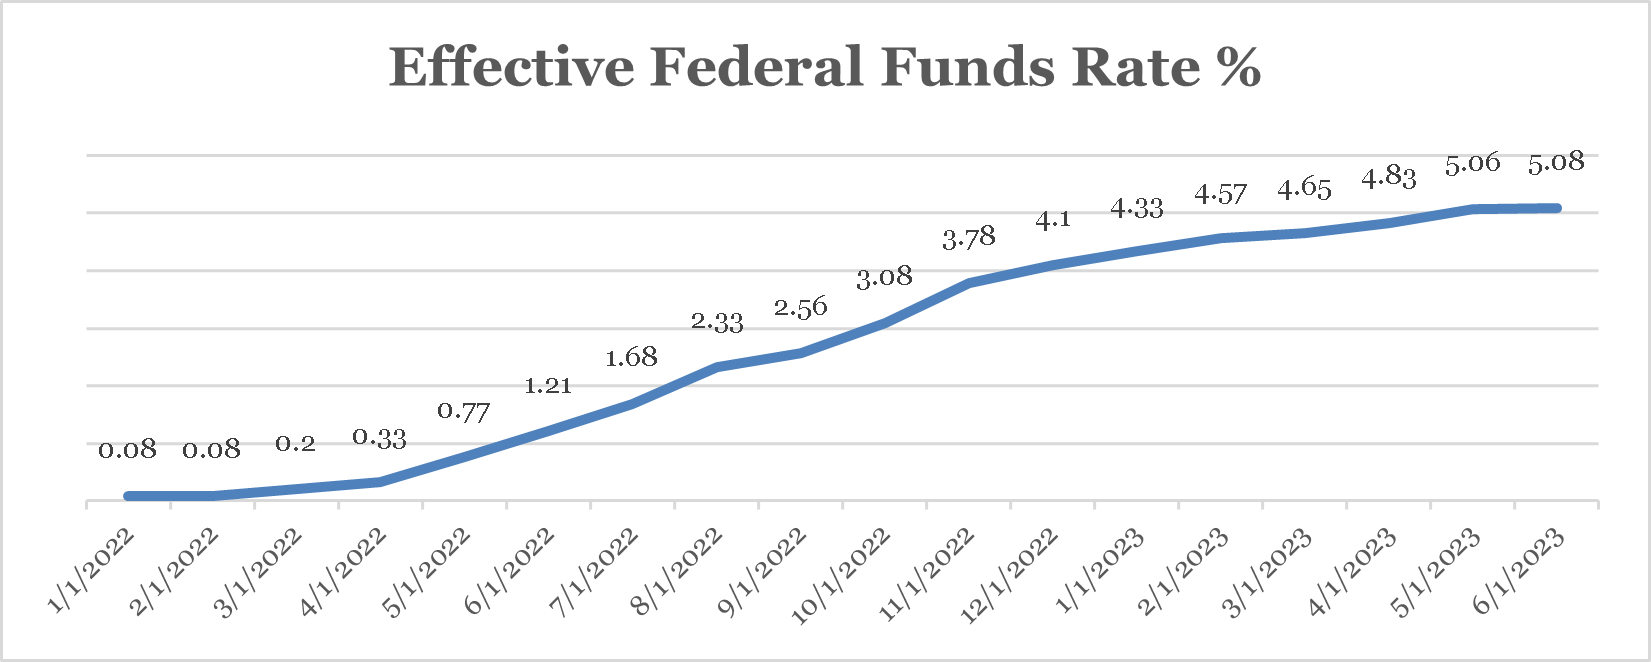
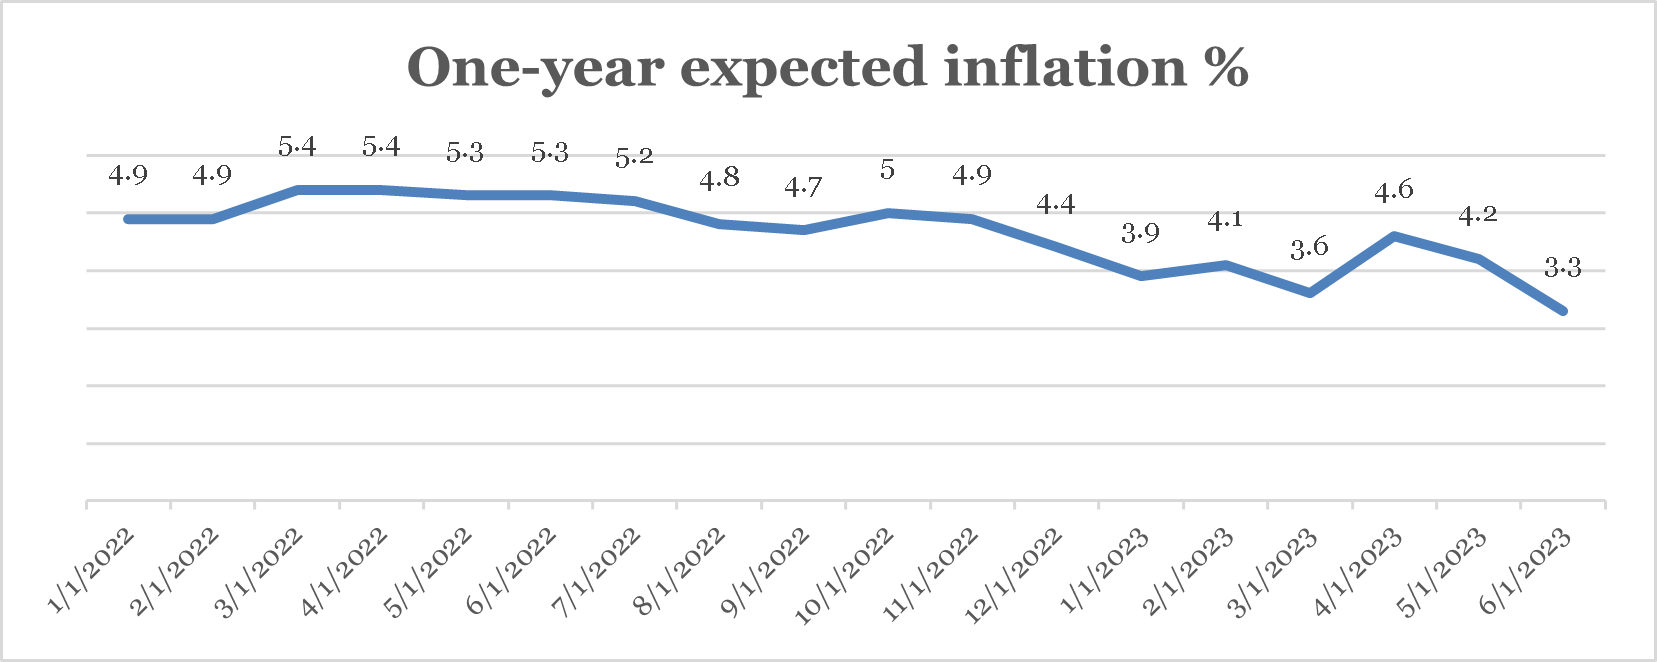
The Fed increased its target Federal funds (Fed funds) rate in late July to 5.25 percent from 5 percent, just as financial market participants were expecting. In real (i.e., expected-inflation-adjusted) terms, the Fed funds rate now stands at around 2 percent, arrived at by subtracting expected inflation reported by the University of Michigan Consumer Survey from the Fed funds rate. [2]
Source: St. Louis Federal Reserve
CLICK ON CHART TO VIEW LARGER IMAGE
The big question for the economy and markets is: is a real Fed funds rate of roughly 2 percent restrictive enough to further reduce core inflation which, as noted, remains higher than the Fed’s long-term goal using the most recent 12-month change in headline PCE? In his post-announcement press conference, Fed Chair Jay Powell indicated that he and his colleagues think so—although he conceded that additional rate hikes may be required.
What’s peculiar about the disinflation experienced in the last 12 months is that it’s come at little-to-no economic cost: the job market is strong; GDP is growing at or above potential; housing may be rebounding; financial conditions are lax [3]; and the U.S. stock market is closing in on historic highs. Traditional economic models suggest that getting inflation under control requires rising unemployment and slowing growth, perhaps even recession. If the Fed is right—and stock markets appear to be betting that it is—2023 will go down as a “miracle year” in economic terms.
We are skeptical, pending more evidence. We would welcome events proving that our skepticism was misplaced.
Article footnotes:
1 The St. Louis Federal Reserve Economic Database is the source of all economic data cited in this newsletter unless otherwise noted.
2 One-year inflation expectations dropped to 3.3 percent in June from 4.2 percent a month earlier.
3 The Federal Reserve Bank of Kansas City’s National Financial Conditions index currently reads -0.39 (more negative values point to “looser” financial conditions), which is about where it was before the Fed began raising interest rates.
INFLATION: DOWN BUT NOT (YET) OUT
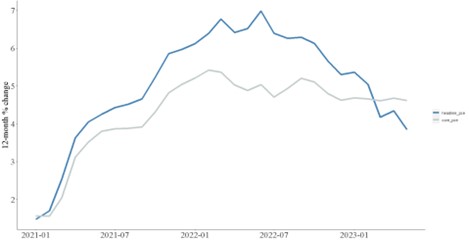
Headline inflation, or the year-over-year price change for all goods and services, has declined substantially in the last two years. Using the Federal Reserve’s (Fed’s) preferred measure, the personal consumption expenditures price (PCE) index, headline inflation has declined from about 7 percent, year-over-year, in June 2021 to under 4 percent in the 12-months ending May 31, 2023. [1]
Headline PCE inflation has declined sharply
12-month percentage change in headline (blue) and core (gray) inflation
Source: St. Louis Federal Reserve
CLICK ON CHART TO VIEW LARGER IMAGE
A Core Concern
“Core” inflation was created in the 1970s to help the Fed identify what’s “really going on” with price increases by removing volatile food and energy prices because they can distort inflation’s trend. And unfortunately for inflation optimists, core PCE inflation’s path (the gray line in the above chart) tells a different story than headline inflation.
Core PCE inflation has fallen only modestly from its peak, and it seems stuck somewhere around 4 percent. Given the usefulness of core PCE inflation in zeroing in on underlying inflation, its stubbornness is a potential cause for concern.
The Fed has indicated that it’s nearly done raising interest its target interest rate (the Fed funds rate), which currently sits at 5 percent, in part because of the decline in headline inflation. Financial markets also believe that the Fed’s job is nearly done—Fed funds “futures” suggest investors expect only one or two more Fed funds hikes. [2] If the trend in inflation is better captured by core PCE inflation, however, the Fed and markets may be getting ahead of themselves. Both the Fed and markets appear to believe that inflation can be subdued without economic cost. While possible, the weight of history suggests otherwise.
Disinflation Typically Isn’t Free
Fed funds rate increases work by making borrowing more expensive. This retards economic activity, slowing price and wage growth. Periods when the Fed is trying to lower inflation by raising interest rates are referred to as “tightenings” because higher borrowing costs constrict economic activity.
Typically, within several quarters of a Fed tightening, the economy starts to sputter—unemployment rises, factories and businesses use less of their capacity, and gross domestic product (GDP) growth slows. This puts downward pressure on prices, which gives us disinflation.
So reliable are economic costs of Fed tightenings and the disinflations that follow that researchers have a way to measure them, called “the sacrifice ratio.” When calculated using past disinflations, the sacrifice ratio suggests that every point reduction in inflation requires a similar increase in unemployment and an even larger fall in economic output as measured by gross domestic product. [3]
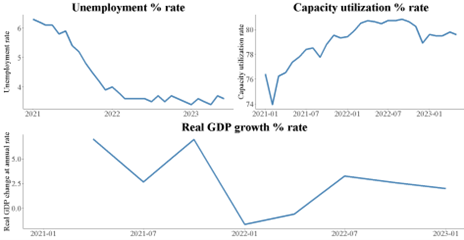
What makes the current disinflation unusual is that there’s been no sacrifice ratio: headline inflation has fallen significantly, but unemployment has stayed the same. In a sense, headline disinflation has been “free.” That is, it has come at little economic cost (so far). If anything, the economy seems stronger than when the Fed began to tighten more than a year ago.
Compared to a year ago unemployment is about the same, businesses are using roughly the same amount of their capacity, and economic growth is stronger
Source: St. Louis Federal Reserve
CLICK ON CHART TO VIEW LARGER IMAGE
In theory, costless disinflations are possible—but this requires assumptions, like a fully credible Federal Reserve and rapidly adjusting prices, that most inflation researchers consider unrealistic.
The current disinflation could also be costless due to gradually easing supply-chain pressures, perhaps directly and indirectly via their effect on inflation expectations. This explanation is easier to swallow. Still, though, it seems to ignore the role of spending sparked by successive rounds of COVID stimulus. Plus, while repaired supply chains combined with declining energy prices have helped to bring down inflation, ongoing high core inflation suggests their effects may be waning. Skeptics of costless disinflation can point to persistent PCE core inflation as evidence that the Fed’s job isn’t yet finished.
The Inflation Fight Probably Has More Rounds To Go
Historically, disinflations have been accompanied by slowing economic growth and rising unemployment. Yet, the current headline disinflation has been relatively painless. Economists are split on the reasons for this, and whether inflation can continue to fall without economic sacrifice. Persistently high core inflation suggests that we’re not out of the inflation woods.
The Fed and investors seem to think differently: the Fed expects to raise its target rate only modestly from its current level, and equity markets are rallying hard on the belief that the worst is over. It is possible that moderating supply chain pressure combined with declining energy prices have brought inflation down considerably, but not enough to qualify as low and stable.
It would be unusual—though very welcome—if the most persistent inflation the U.S. economy has experienced since the 1970s has been curbed without any economic sacrifice. Given the history of inflation and unemployment, this still seems like a long shot.
Article footnotes:
1 The St. Louis Federal Reserve Economic Database is the source of all economic data cited in this article.
2 CME Fed Fund Futures online tool.
3 Mankiw, N.G. 2016. Macroeconomics. 9th Edition. Worth Publishers.
4 It is also a little unsettling, since what supply shocks give, they can also take away—i.e., a bounce in energy prices could drive headline inflation, and with it core inflation though to a lesser extent, right back up.
HOUSING AND THE ECONOMY – IT’S COMPLICATED
Between 1995 and July 2006 home prices rose about 130 percent according to the Case-Shiller National Home Price Index, an unprecedented rise. [1] We all remember what happened next. House prices fell by roughly 27 percent between 2006 and 2012. An economic and market crunch on par with the early stages of the Great Depression followed.
The housing crash not only contributed to a contraction of the U.S. economy so severe that it became known as the “Great Recession.” [2] It also deprived consumers of an important source of collateral for loans (home equity), crimping spending on furnishings and other “durable” goods associated with new home purchases or remodeling. This stunted economic growth for years after the Great Recession’s official end in June 2009.
So traumatic were these events that every wiggle in home prices is now monitored closely for signs of economic trouble. And when home prices began to slide last year as mortgage rates rose, economists and investors became concerned.
When that trend reversed early this year as prices started to creep back up, many were no doubt relieved. Whether that relief is warranted may depend on more than a price recovery, however.
Home price recovery stumbles, then recovers
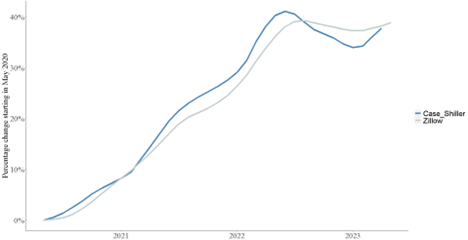
For the first two years of the current economic expansion, which began in May 2020 [4], home prices shot up by a little over 40 percent nationally according to the Case-Shiller index (the blue line in the chart below) and about as much according to the Zillow Home Value index (the gray line).
Home prices grew rapidly nationwide from mid-2020 through mid-2022
Source: St. Louis Federal Reserve
CLICK ON CHART TO VIEW LARGER IMAGE
Before 2022, the next largest 2-year increase in the history of the Case-Shiller index was from late 2003 to late 2005 when prices grew by about 30 percent. And much like the prior episode, this time around a fast-growing economy and rising inflation prompted the Federal Reserve to raise its target interest rate. Mortgage rates also rose: the 30-year fixed rate mortgage rose from 2.65 percent in early 2021 to 7.1 percent by November 2022. Over the same period, mortgage payments as a percentage of personal disposable income rose from under 3.5 percent to about 4 percent. Predictably, home prices began falling—notice the hump in both series in the chart above.
Analysts and homeowners living with the memory of the Great Recession watched this unfold with apprehension. Then something unexpected happened.
Despite continued high mortgage rates, home prices started to recover: both the Case-Shiller and Zillow national home prices indexes in the chart above turned around in early 2023. Since, they’ve been slowly moving up (notice the upward bend in both the blue and gray lines in the chart above) and are down only modestly—about 2.2 percent in the case of the Case-Shiller index from their all-time highs.
Housing’s Economic Effects
The rebound in home prices is certainly good news for homeowners reliant on home equity for spending. But home prices and home-equity fueled spending aren’t the only type of housing-related activity that matter for the economy. Homebuilding matters too.
Homebuilding or “residential fixed investment” currently makes up about 4 percent of gross domestic product (GDP), much more than housing-related spending’s 2 percent of GDP. While neither figure may sound impressive, housing construction in particular punches above its weight: large drops in homebuilding can tip the economy into recession all else equal.
This nearly happened in 2022. For each of the last 8 quarters (ending in Q1 2023), residential fixed investment dragged GDP down by an average of over ½ of one percent (annualized). This was enough to help cause GDP to shrink for two consecutive quarters in the first half of 2022, nearly plunging the economy into recession. [3] But you wouldn’t have known this if you were just watching home prices: they continued to rise despite the weakness in construction.
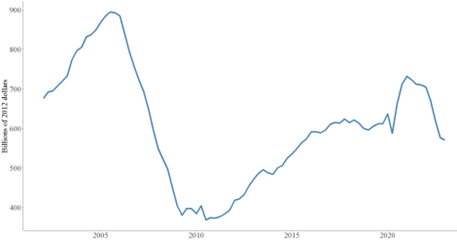
Early indications are that they have not. The chart below shows residential fixed investment (blue line) through the latest reading, March 2023. Unlike the trend in prices, the trend in home construction continues to point down. Home construction appears to continue to be a headwind for GDP growth.
Residential fixed investment (blue line) was falling as of March 2023
Source: St. Louis Federal Reserve
CLICK ON CHART TO VIEW LARGER IMAGE
But home construction data is quarterly—the snapshot above is through March 31, 2023—and could be stale. A timelier window on future construction may come from permits for new private homes, which fell more or less steadily from the end of 2021 through early 2023. But they’ve since leveled off.
Since permits lead construction—permission is required before building can begin—the apparent stabilization in building permits may suggest less of a GDP headwind from residential fixed investment in future quarters. But it’s too soon to say.
Rising Prices are Nice, but More Construction is Needed
Home prices get a lot of attention in the financial press. While rising home prices and home equity and good for consumer confidence and spending, what happens to housing construction is probably at least as important for economic growth.
Sagging residential fixed investment nearly tipped the economy into recession in the first half of 2022. And while higher prices should elicit more building, we saw in 2021 and 2022 that prices and more construction don’t necessarily move together.
The economy can grow while home construction is shrinking—the last three quarters show this. But prospects for growth would improve if the recent turnaround in home prices translates into more building. So far, the jury’s still out.
Article footnotes:
1 Source: The St. Louis Federal Reserve Economic Database is the source of all home price index, mortgage rate, and economic data referenced in this article unless otherwise noted.
2 Real (after-inflation) GDP fell by about 3.9 percent between 2007:Q4 and 2009:Q2, larger than the 2.9 percent fall in the recession of 1981-1982, which was previously the most severe contraction since the 1930s.
3 Source: U.S. Commerce Department Bureau of Economic Analysis. 4 The National Bureau of Economic Research determines recession start and end dates.
Delivered to your inbox.
We aim to release two newsletters a month, one focused on financial planning and another on investing. If you are interested in having our monthly newsletters delivered directly to your email inbox, choose what topic you prefer and submit this form. Thank you for your interest in our newsletters.
SCHEDULE A MEETING
With all that is going on in markets and the economy, you might want a second set of eyes on your financial plan, or maybe you need to build a financial plan for the first time. Either way, our advisors are available throughout New England, and we are happy to schedule a time to meet. If you’d like to set up an appointment, click here, or call us at 800-393-4001 to schedule your meeting.
Our mailing address is:
144 Gould Street, Suite 210
Needham, MA 02494
The opinions and forecasts expressed are those of the author, and may not actually come to pass. This information is subject to change at any time, based on market and other conditions and should not be construed as a recommendation of any specific security or investment plan. Past performance does not guarantee future results.
Armstrong Advisory Group, Inc. does not offer tax or legal advice and no portion of this communication should be interpreted as legal or accounting advice. You are strongly encouraged to seek advice from qualified tax and/or legal experts regarding any tax or legal matters relevant to you.
ARMSTRONG ADVISORY GROUP, INC. – SEC REGISTERED INVESTMENT ADVISER
The information contained herein, including any expression of opinion, has been obtained from or is based upon, sources believed to be reliable, but is not guaranteed as to accuracy or completeness. This is not intended to be an offer to buy, sell or hold or a solicitation of an offer to buy, hold or sell the securities, if any referred to herein.
All investments involve the risk of potential investment losses. An investor cannot invest directly in an index. Diversification seeks to reduce the volatility of a portfolio by investing in a variety of asset classes. Neither asset allocation nor diversification guarantees against market loss or greater or more consistent returns. Bonds are subject to interest rate risk and if sold or redeemed prior to maturity, may be subject to additional gain or loss. Armstrong Advisory does not provide any tax or legal advice; please consult with your tax and legal advisers on such matters.

