Investing Newsletter 7.23
June 2023 economic, market and policy update
The economy
The current economic expansion began in May 2020. It has lasted over three years. This is not particularly long by historical standards. Nevertheless, recession worries persist. Despite these concerns, there were no obvious signs of an impending economic downturn in May.
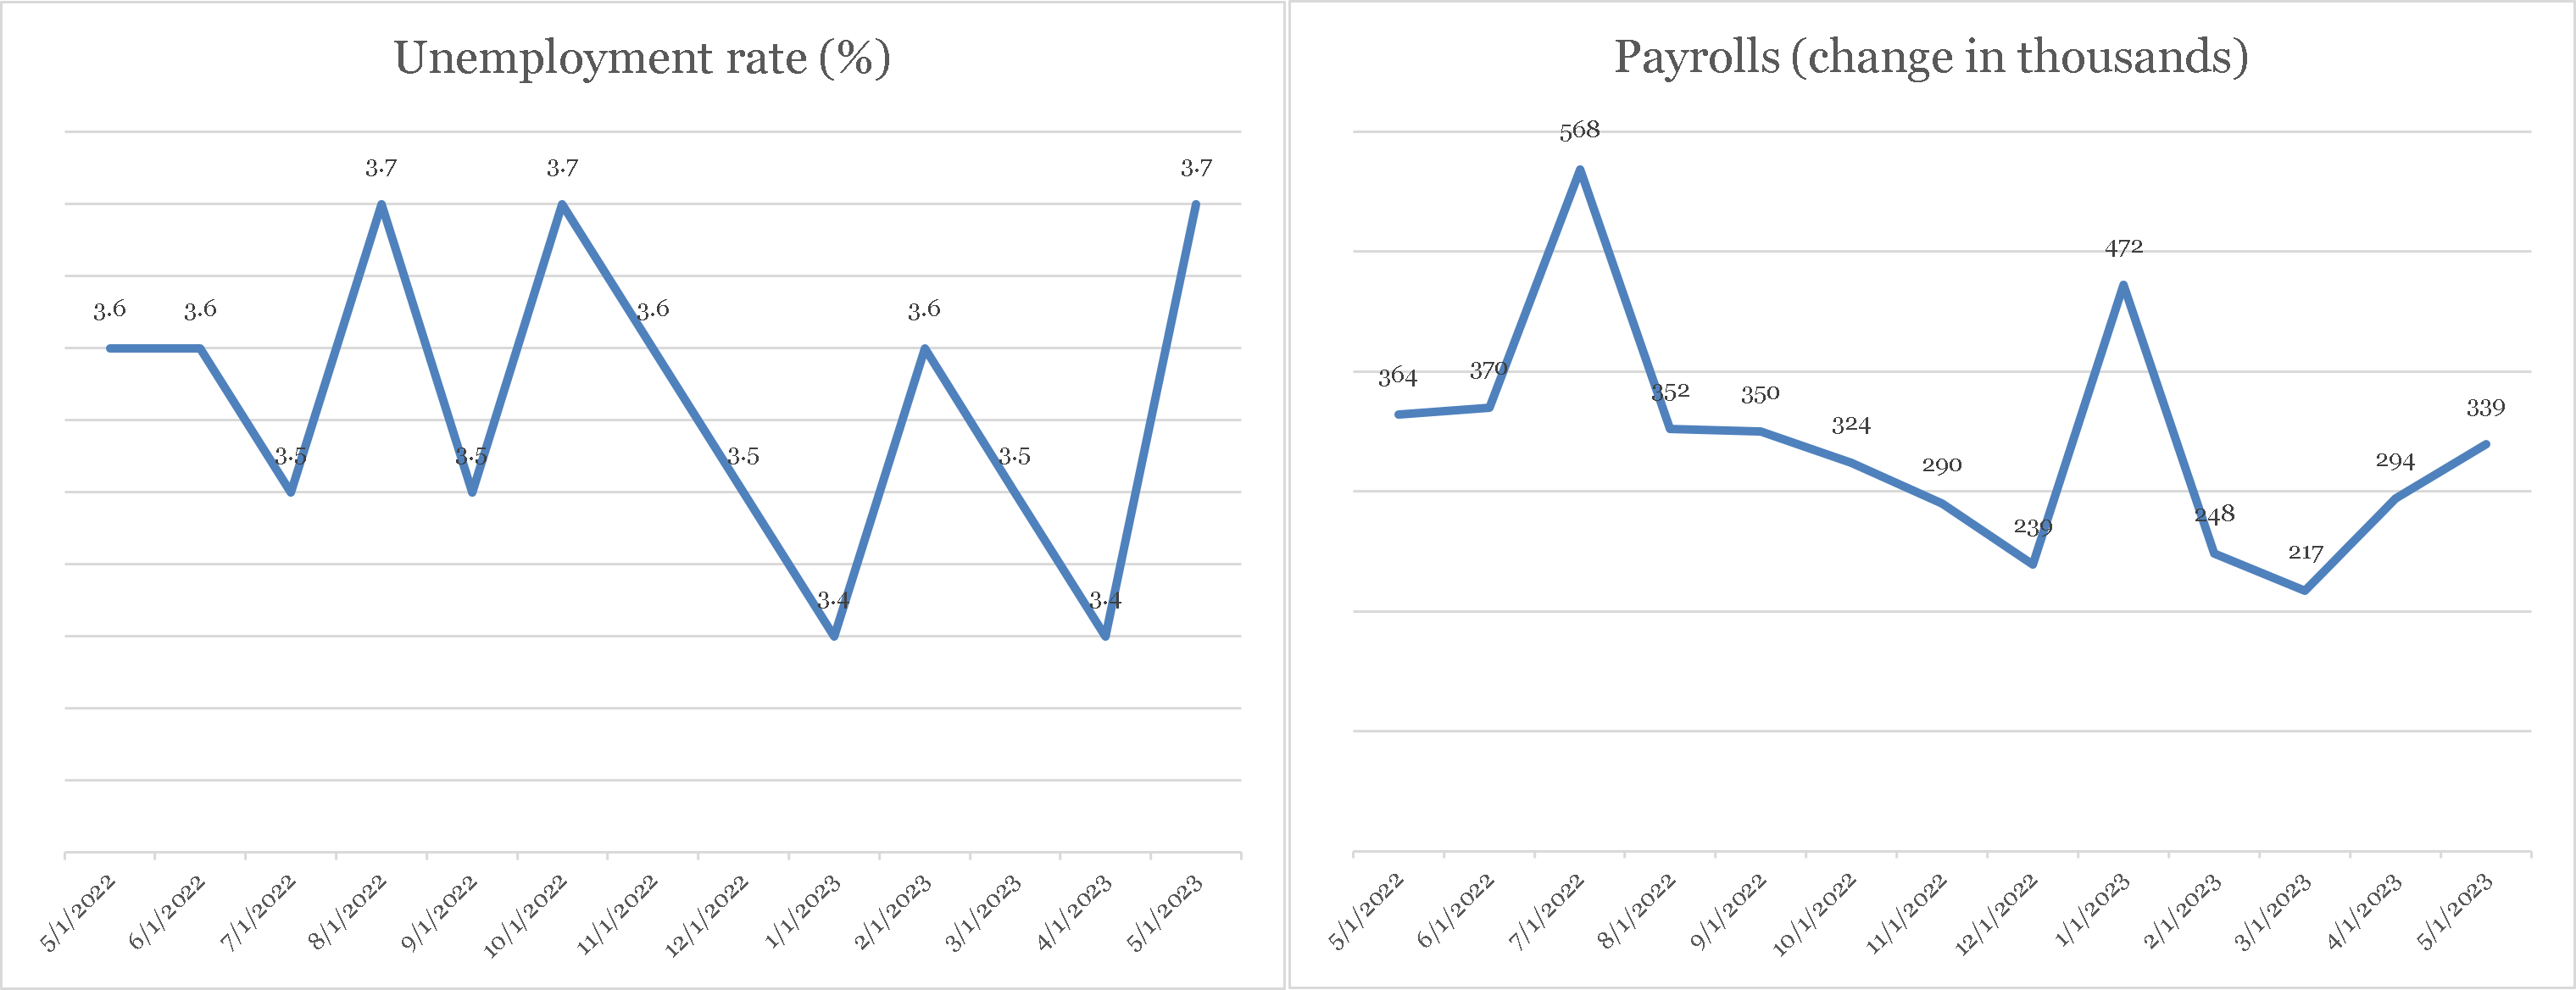
Unemployment, a lagging indicator because it is slow to reflect changes in economic activity, did rise in May to 3.7 percent of the labor force from 3.4 percent in April according to a survey of households. [1] But joblessness remains at unusually low levels: it has been below 4 percent since February 2022, the longest such monthly streak since the legendary economic expansion of the late 1960s. Meanwhile the number of new jobs reported by businesses rose to a three-month high of 339,000, well above their prior-six-month average of 293,000. Both surveys suggest job market strength.
Source: St. Louis Federal Reserve
CLICK ON CHART TO VIEW LARGER IMAGE
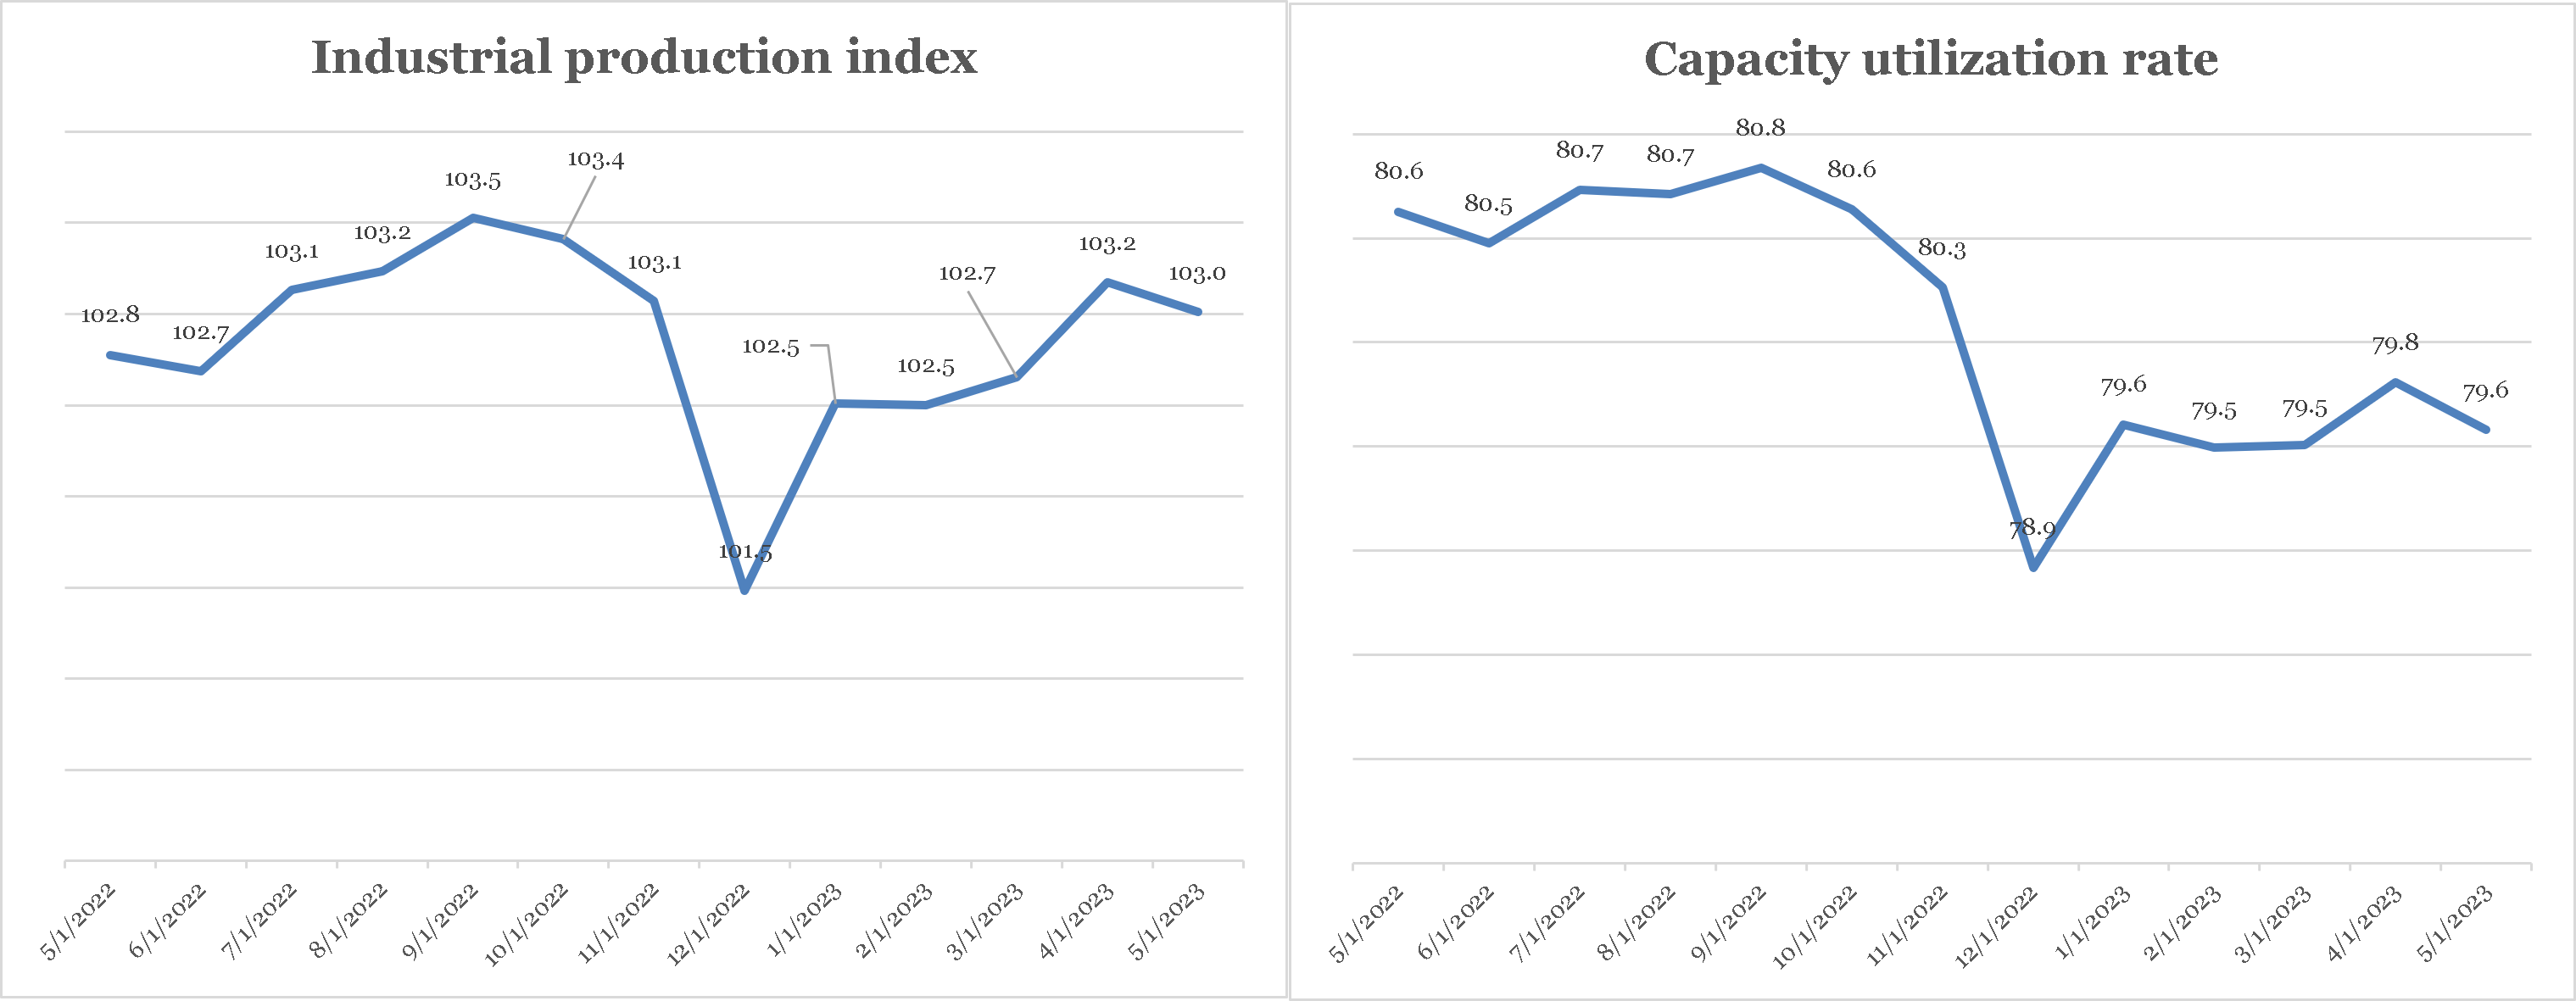
The output side of the economy was strong in May, too. Industrial production—the total real (inflation-adjusted) output of companies in manufacturing, mining, and utilities—dipped slightly but remained high. At the same time capacity utilization, or the fraction of potential output used by companies, was steady. Businesses continue to produce at the highest levels of the current expansion, and to use most of their available machines, workers, and assets generally while doing so.
Source: St. Louis Federal Reserve
CLICK ON CHART TO VIEW LARGER IMAGE
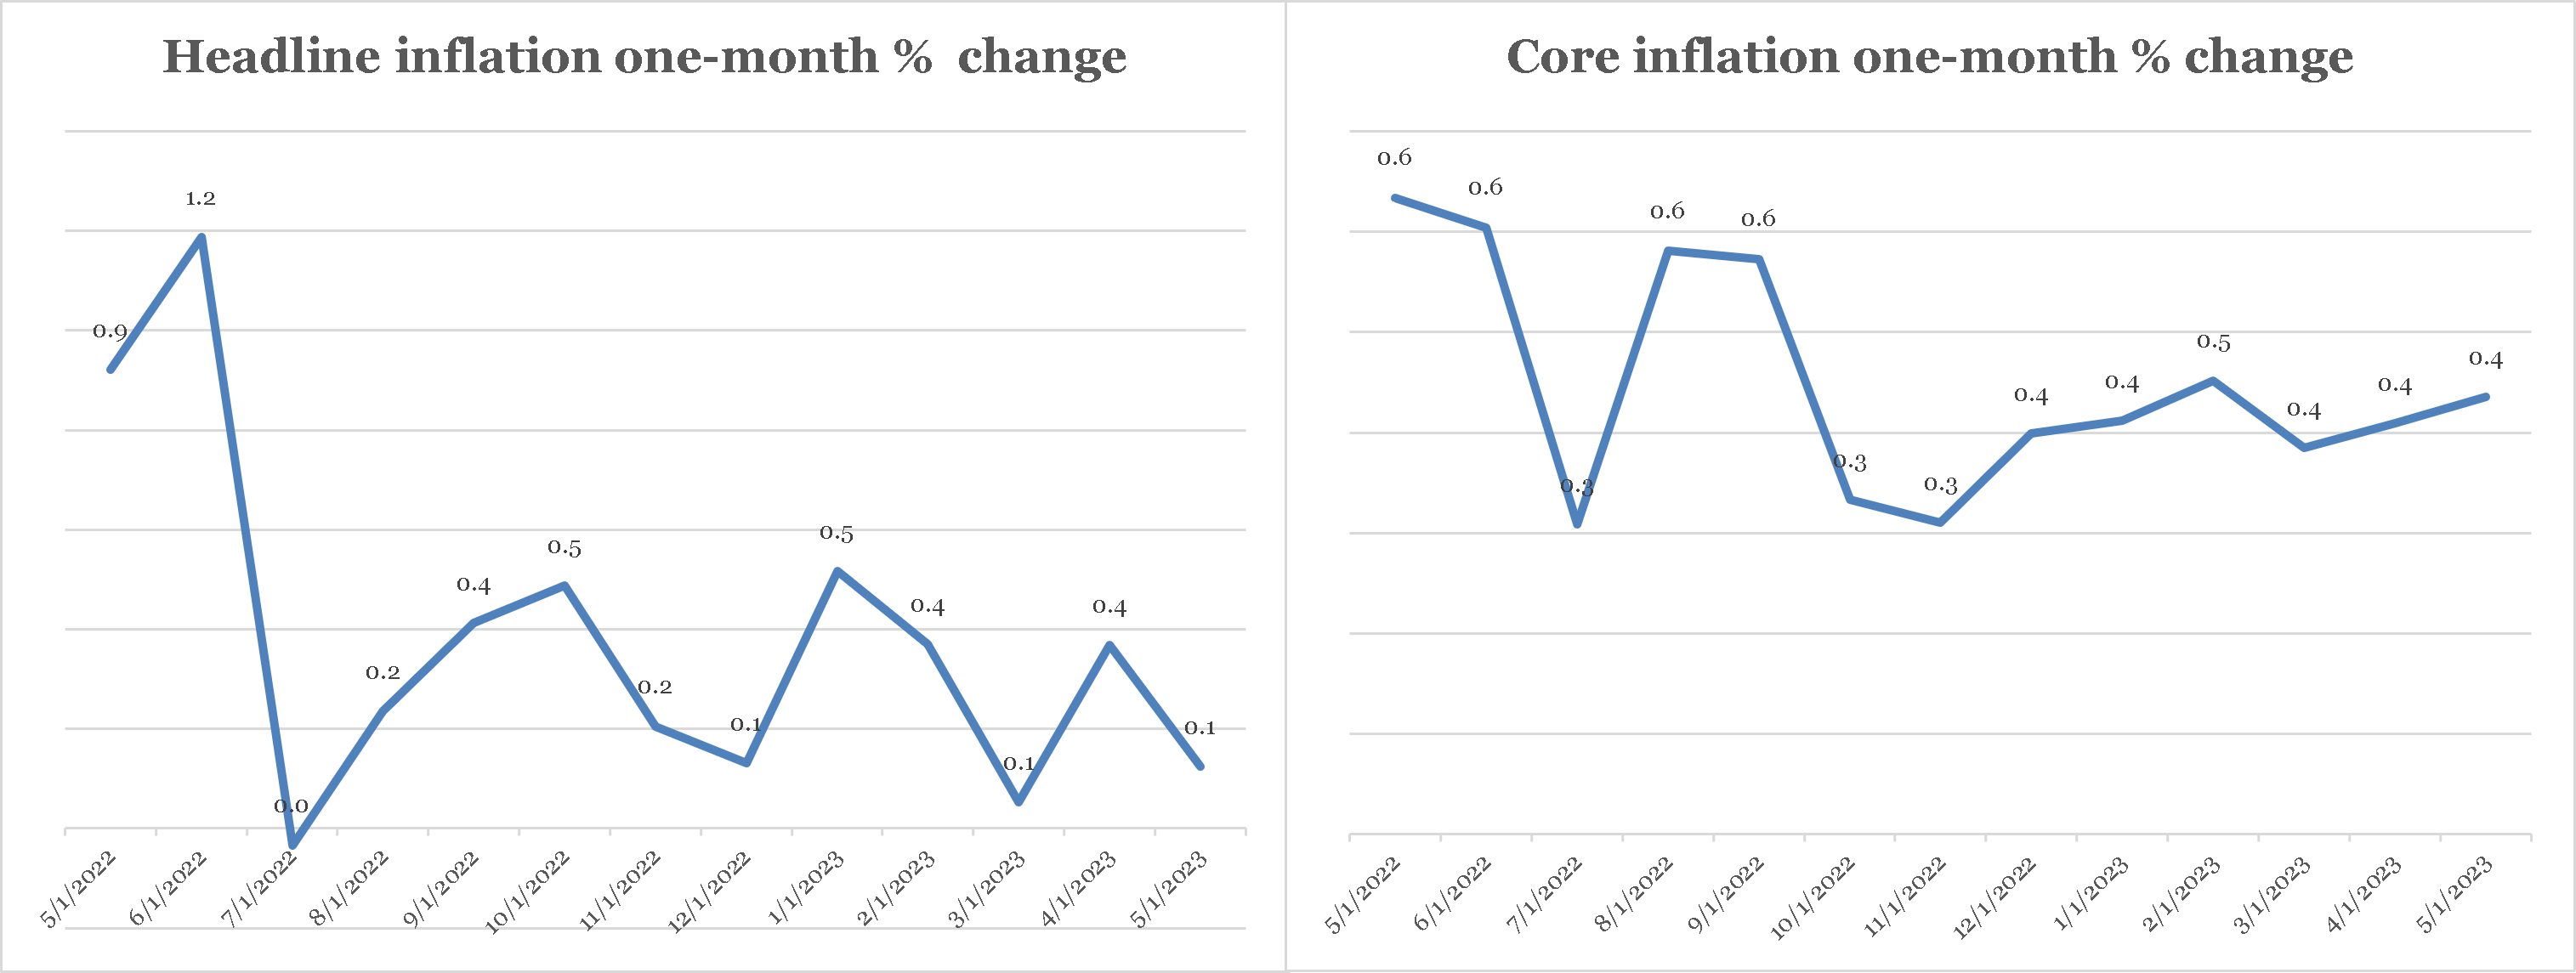
Since economic output is made up mostly of spending, a fall in consumption could point to economic trouble ahead. But advance retail sales gained about as much in May as in April, and overall spending (personal consumption expenditures) rose 0.1 percent during the month. Some of the increase in spending was because of inflation, or the change in the price of goods and services. Since inflation makes things more expensive, spending usually follows inflation up.
The change in “headline” (all goods and services) inflation was 0.1 percent in May, month-over-month, according to the consumer price index (CPI). So about 0.2 percent of the rise in retail sales spending was real. Core CPI inflation, which removes erratic food and energy price changes to isolate the trend in inflation, didn’t budge in May (+0.4 percent, month-over-month). It has been stuck in the range of an annualized 5 percent or so for several months. Other measures of the trend in inflation confirm that price increases remain in the low-to-mid single digits.
Source: St. Louis Federal Reserve
CLICK ON CHART TO VIEW LARGER IMAGE
Economic Policy
The U.S. Treasury is by law permitted to issue only a certain amount of debt. That “debt ceiling” is $31.4 trillion, and it was reached earlier this year. Since then, receipts from taxes, tariffs, fees, etc. as well as accounting tricks have allowed government spending to continue at levels approved by the last Congress.
In the final week of May, the Biden Administration came to an agreement with the Republican leadership in the House of Representatives to raise the debt ceiling in exchange for a cap on some forms of government spending, making some forms of government assistance contingent on employment, and other concessions.
At the time of this writing, the agreement had yet to be voted upon by the Congress. The U.S. Treasury expects to run out of ways to maintain previously determined spending levels without new borrowing by sometime in early June (the “x” date). At that point, if the agreement hasn’t been approved, Federal spending must be cut to equal Federal revenue. This cut will reduce overall demand and, if not reversed quickly, could dent short-run economic growth.
As an investment advisor, our focus is on what the unlikely failure of Congress to pass the debt-ceiling agreement would mean for capital markets. Some predict massive declines in stocks and bonds. [2] Our view is more nuanced. Passing the x-date without Congressional approval of the debt-ceiling agreement could indeed shake markets—stocks and bonds might both drop sharply. But the damage would probably be short-lived if the deal is approved quickly. A similar panic sell-off followed by relief rally followed the failure then passage of bank bailout legislation during the depths of the financial crisis of 2008-9. A brief market quake could be just what legislators and the Administration motivate them to accept the compromise reached by the Biden Administration and Republican leadership.
Of course, none of this self-inflicted market volatility makes the Federal Reserve’s (Fed’s) inflation-fighting task any simpler. Inflation, which the Fed controls in the long run, has slowed as noted in the first section. But, as also noted, it remains well above the Fed’s stated 2 percent per year goal. Thus, the Fed continued to raise its short-term policy rate target (the “Fed funds” rate”) in May by increasing its target by 0.25 percent to 5 percent. The Fed’s policy-making committee meets again in mid-June, and “futures” markets currently put the chances of another 0.25 percent increase (to 5.25 percent) at about 60 percent. [3]
Whether this will be enough to not only halt but also reduce inflation growth depends on an imaginary construct economists call the “neutral” rate of interest. As the name suggests, the neutral rate is the level of Fed Funds that keeps inflation steady. With Fed funds now at 5 percent and expected inflation somewhere around 4 percent, the real (after expected inflation) Fed funds rate is about 1 percent. If that’s more than the neutral rate, inflation should continue to come down all else equal. If it’s less, inflation could stay stuck at an unacceptably high rate. Unfortunately, we won’t know whether the Fed has done enough for several months. Given inflation’s tenacity, the Fed may have to hike rates once or twice more.
Article footnotes:
1 The Federal Reserve Bank of St. Louis Economic Database is the source of all economic data cited in this article.
HOW WE THINK ABOUT ARTIFICIAL INTELLIGENCE
The dramatic snapback in tech share prices seems to be due to two factors. One, the belief that the Fed is finished, or nearly so, with raising its target rate to tame inflation. And two, hopes that artificial intelligence (AI) will usher in a new era of growth, led by existing tech companies. The latter rally catalyst is the focus of this article.
Even casual consumers of financial-market news know that investors can’t stop talking about AI, catch-all term for computer programs that can “learn” by “teaching themselves.” AI isn’t new. Online shopping companies have been using AI for years to make personalized recommendations, for instance. But it’s certainly stoking investor excitement—and stock prices—like never before.
AI hype vs. economic reality
For long-term investors, what matters is how AI might affect returns on stocks and other asset classes. And as non-computer-science experts, we prefer to think about the potential impact of AI on the economy in general terms.
Generally, AI is a tool that may make workers more productive. AI-based computer programs can help their users come up with better answers to any number of questions more quickly. If its promise is realized, AI should eventually raise productivity, economic growth, and standards of living.
At the same time, AI will create “losers.” Some workers will get displaced. Historically, new technologies have created more “winners” than losers, however, and that’s why income per person has grown over time. The question for investors is, how much growth, on the margin, will AI spur?
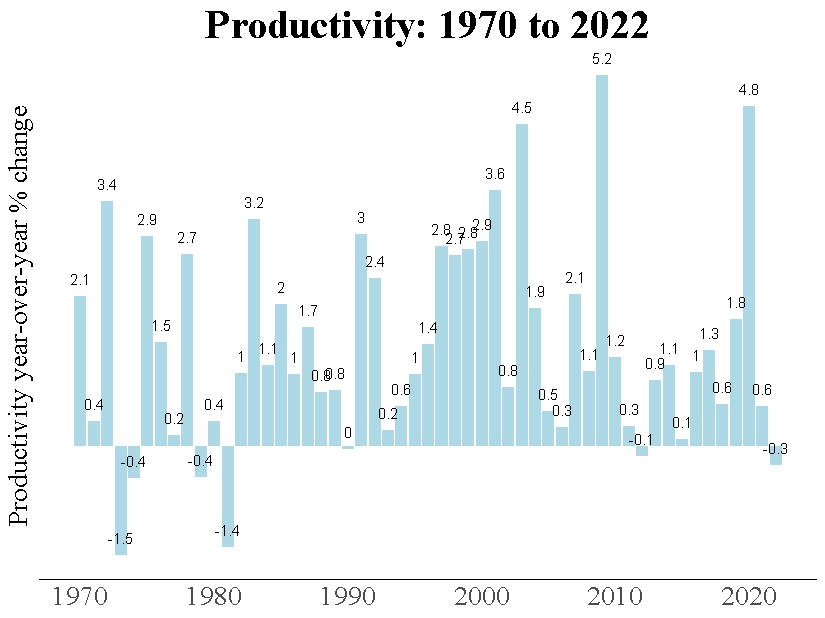
The best guide from recent history is the internet, or more generally networked computers (the “computer-internet revolution”). Starting in the mid-1980s, even non-technical workers experienced gradual computer-driven productivity gains as software run on desktop computers replaced typewriters and paper spreadsheets. The result of the computer-internet revolution was an eventual rise in overall productivity, which culminated in a boom in worker efficiency during the mid-1990s and petering out by around 2004.
Source: U.S. Bureau of Labor Statistics
CLICK ON CHART TO VIEW LARGER IMAGE
This first half of the productivity surge was accompanied by skyrocketing technology-stock prices. But enthusiasm for tech stocks waned as economic growth slowed, and the “tech bubble” eventually burst.
The impact of the computer-internet revolution was powerful, as anyone who lived through it remembers. But it was relatively short lived. And its effects were disappointingly modest on a per person, standard-of-living basis.
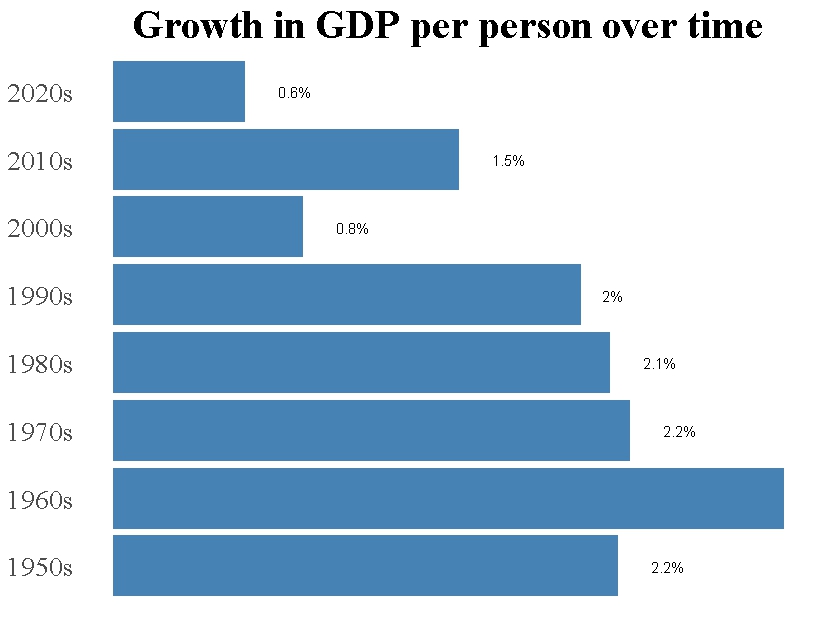
Real GDP per capita (per person) measures how much better off we are, on average, as time passes. Real per capita GDP growth was strong in the 1990s, the height of the computer/internet revolution, compared to the 2000s, but it was lower than in the 1980s and the 1970s. [1] By this measure of living standard growth, the U.S. economy slowed in the 1990s despite the computer-internet revolution!
Source: U.S. Department of Commerce
CLICK ON CHART TO VIEW LARGER IMAGE
While computers almost certainly helped growth—that is, the economy would have grown less without them—the 1990s don’t stand out as anything exceptional in the broad sweep of time. Remarkably, the computer/internet revolution didn’t noticeably change the path of overall economic growth.
Curb your AI enthusiasm
The computer-internet revolution didn’t change the long-term trend in economic growth—it shows up as barely a blip. And the productivity and stock market gains that accompanied widespread computer adoption weren’t sustained.
AI holds the promise of making many jobs easier. But whether AI will meaningfully change the path of overall economic growth is an open question.
Article footnotes:
1 Source: U.S. Department of Commerce.
BULLS, BEARS AND LONG-TERM INVESTING
Stocks have been on a run since late 2022, and their rebound has been christened by some commentators as a new “bull market.” What are long-term investors to make of this?
Classifying bull and bear markets
Bull markets happen when stocks are rising, and “bear” markets occur when they are falling. The origin of these terms is disputed. Whatever their basis, naming market climates after powerful, unpredictable beasts certainly seems fitting.
While there’s no formal definition of bull and bear markets, “20-percent” rules are popular. When stocks rise 20-or-more percent from a bear-market low, they are said to be in a bull market. And when stocks fall more than 20-or-more percent from a high, they are said to be in a bear market.
Bull and bear markets get a lot of attention from the financial press. But should long-term investors really care which of these unruly animals investors are under the spell of? To answer that question, we start with a survey of the record of stocks in bull and bear markets.
A short history of market ups and downs
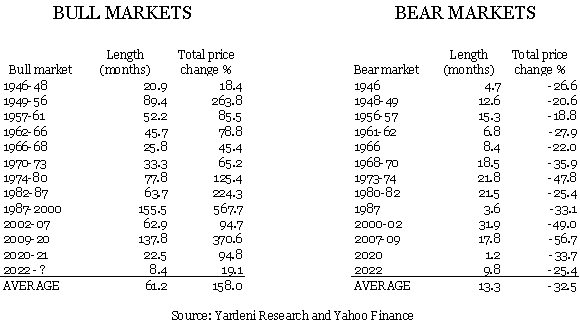
Using the 20-percent rule, there have been 12 bull-bear market pairs since the end of World War II (WWII) according to research firm Yardeni Research. We show them in the tables below, along with bull or bear market length and total S&P 500 index price (i.e., excluding dividend) change. [1]
Source: Yardeni Research and Yahoo Finance
CLICK ON CHART TO VIEW LARGER IMAGE
Bear markets tend to be quick and painful, while bull markets tend to be long and rewarding. Bull markets are, on average, much longer than bear markets. They also feature much larger price changes overall. Specifically, bull markets lasted about 5 years and resulted in a total price return of about +158 percent, on average. Bear markets lasted about a year and resulted in a total price change of -32.5 percent.
Starting in 1982, differences between bull and bear markets became more pronounced. While both got longer in proportional terms—bear markets by an average of about 3 months and bull markets by an average of about 40 months—bull market length increased by almost 80 percent on average.
And while both became more intense, gains in bull markets averaged much more post-1982 than (the absolute value of) losses during bear markets in decades prior. This extreme lengthening of bull markets was part of a broader economic shift known as the “great moderation.” By virtually every measure, the economy became calmer, overall, in the 1980s, 1990s, and early 2000s. Unsurprisingly, stock markets thrived with only a couple of interruptions.
Finally, the most recent bear market, which ended last year, was both shorter and shallower than average—but it was neither the shortest nor the shallowest in the post-WWII period. The distinction of shortest bear market goes to the sharp drop in the stock market that followed the quick recession of 1946 as the Federal government dramatically cut military spending. The shallowest, meanwhile, preceded the relatively mild recession of 1957. And the bull market that preceded it, which ended at the close of 2021, was the second shortest on record. Despite this, its return was in the top half of all bull markets.
The key feature of bull markets is that they’ve tended to last: None has been shorter than nearly two years, historically.
Bull vs. bear: should we care?
As we’ve seen, bull markets have shown more staying power than bear markets: They have more “momentum” once they get going. This should give investors comfort. It also shouldn’t surprise them.
We know that stocks have delivered positive returns over extended periods—they tend to go up if held long enough. This is because stocks are tied to economic growth, which also tends to go up. And anything that goes up over time that also sometimes goes down must at some point go up by more!
The reason behind this is straightforward. Stocks can only deliver positive returns if their average monthly (or daily) gain is greater than their average monthly loss, or if the length of the period of gains exceeds the length of the period of losses. Since the average bull market monthly gain was about 1.6%, and the average bear market monthly loss was over 2%, bull markets must have lasted longer than bear markets. But their timing and extent vary.
So, the answer to the question above is “yes, we should care.” But, as we now know, the question isn’t an interesting one. If you invest in stocks because you believe they will grow on average and over time, you must also believe that there will be bull markets. Bull markets are required for long-term growth.
There is, however, one way in which knowing whether we are in a bull or bear market could be useful. As we noted, both tend to last more than a few months. Therefore, a reasonable guess early in a market of either type is that it will carry on for a while. This is one way of saying that stocks exhibit “momentum,” and it jibes with lots of evidence and most peoples’ experience.
The trick is knowing what kind of market we are in. Bull- and bear-market start-and-end dates aren’t known until after the fact. It is possible that the very day one or the other is declared is also its last day, though history suggests this is unlikely.
Learn to live with wild animals
By a common rule, bull markets happen when stocks go up 20-or-more percent following a prior 20-or-more percent decline or bear market. Bull markets tend to be relatively long, and they have delivered the returns that powered stocks to increasingly higher highs over time. Bear markets have been relatively short interruptions to the uptrend of stocks.
Bulls and bears are wild, unpredictable animals. But they are also familiar—we’ve learned to live with them, and even find uses for them. Like their namesakes, bull and bear market environments are also just part of life. To successfully coexist with them, investors need to appreciate the role of both—and not be startled by either.
Article footnotes:
1 Source: Yardeni Research and Standard & Poor’s price returns reported by Yahoo Finance.
Delivered to your inbox.
We aim to release two newsletters a month, one focused on financial planning and another on investing. If you are interested in having our monthly newsletters delivered directly to your email inbox, choose what topic you prefer and submit this form. Thank you for your interest in our newsletters.
SCHEDULE A MEETING
With all that is going on in markets and the economy, you might want a second set of eyes on your financial plan, or maybe you need to build a financial plan for the first time. Either way, our advisors are available throughout New England, and we are happy to schedule a time to meet. If you’d like to set up an appointment, click here, or call us at 800-393-4001 to schedule your meeting.
Our mailing address is:
144 Gould Street, Suite 210
Needham, MA 02494
The opinions and forecasts expressed are those of the author, and may not actually come to pass. This information is subject to change at any time, based on market and other conditions and should not be construed as a recommendation of any specific security or investment plan. Past performance does not guarantee future results.
Armstrong Advisory Group, Inc. does not offer tax or legal advice and no portion of this communication should be interpreted as legal or accounting advice. You are strongly encouraged to seek advice from qualified tax and/or legal experts regarding any tax or legal matters relevant to you.
ARMSTRONG ADVISORY GROUP, INC. – SEC REGISTERED INVESTMENT ADVISER
The information contained herein, including any expression of opinion, has been obtained from or is based upon, sources believed to be reliable, but is not guaranteed as to accuracy or completeness. This is not intended to be an offer to buy, sell or hold or a solicitation of an offer to buy, hold or sell the securities, if any referred to herein.
All investments involve the risk of potential investment losses. An investor cannot invest directly in an index. Diversification seeks to reduce the volatility of a portfolio by investing in a variety of asset classes. Neither asset allocation nor diversification guarantees against market loss or greater or more consistent returns. Bonds are subject to interest rate risk and if sold or redeemed prior to maturity, may be subject to additional gain or loss. Armstrong Advisory does not provide any tax or legal advice; please consult with your tax and legal advisers on such matters.

