Investing Newsletter 3.23
How the Federal Reserve Influences Inflation
The Federal Reserve (Fed) has raised its target interest rate from zero at the start of 2022 to 4.5% today to attempt to slow inflation. But how exactly do these rate increases work to affect the price of goods and services?
The Fed’s job
The Fed is responsible for controlling the supply of money in the US economy, and other goals like ensuring maximum employment. In the long run, the supply of money determines the level of prices and the change in the level of prices. We call this change inflation when prices rise, and deflation when they fall.
The Fed’s control over the how much money people choose to hold, and how this translates into inflation, is complicated. But the short explanation is that Fed rate increases subdue inflation by curbing economy-wide demand. When the Fed’s target interest rate, known as the Fed funds rate, goes up, some borrowing costs move in lockstep. This makes it harder for consumers and companies to finance spending and investment, slowing the economy.
Fed funds and borrowing rates
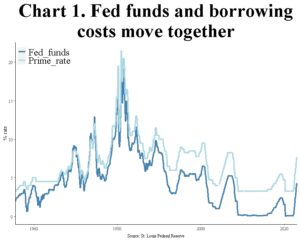
Take, for example, the “prime” rate, or the minimum rate at which a bank will lend to its most creditworthy borrowers. That the prime rate moves one-for-one with Fed funds is clear from the history of both, shown in chart 1. The two rates differ by a consistent amount of about three percent.
When the Fed raises its Fed funds target, the prime rate goes up. And when the prime rate goes up, businesses may make fewer investments and consumers may buy less. The actual impact of a Fed rate hike on investment and spending depends on the size and speed of rate increases, and on the state of business’ profits and consumers’ income. This is because, in a strong economy, profits and incomes might be rising by enough that companies and firms brush off rate increases and continue to increase investing and spending. That’s not typically the case, however.
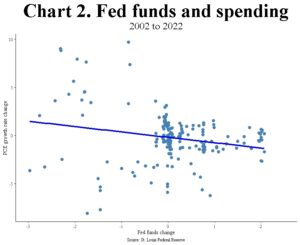
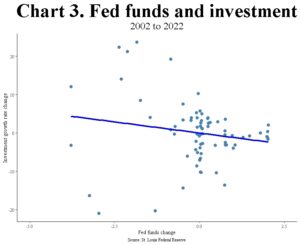
Chart 2 shows the relationship between the change in Fed funds rate, where positive changes indicate rate raising or “tightening” by the Fed, and the change in the growth rate of spending. Chart 3 shows the relationship between the change in Fed funds and the change in the growth rate investments by businesses. In both cases, the relationship with Fed tightening is negative, on average. This is shown by the downward shaped cloud formed by the points in each chart, and highlighted by the downward sloping lines “fit” to these points. When the Fed hikes, consumers and businesses cut spending.
But that’s not the end of the story. Retrenchment by firms and consumers doesn’t by itself cause inflation to decline. Rather inflation recedes when, in response to falling demand, companies cut prices and wages—or slow their rate of growth. And widespread or large price reductions are, by definition, a fall in inflation. Interestingly, if these reductions were immediate, all prices and wages would adjust to the new level of demand, and economic pain would be brief and limited. But these reductions don’t happen instantly. Prices and wages are slow to adjust, resulting in recession and unemployment.
Fed hikes affect interest rates differently
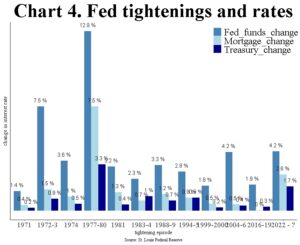
We’ve seen that when the Fed raises its Fed funds target, the prime rate goes up. So do other rates that consumers bear directly, like those charged by banks to credit card and personal loan customers. But not all interest rates go up equally when the Fed tightens. Chart 4 shows the change in three kinds of interest rates for nine Fed tightening episodes since 1971 [1]: the Fed funds rate, which the Fed targets directly; the 30-year mortgage rate; and the 10-year US treasury bond rate.
Two facts stick out. One, Fed funds always rises by more—sometimes a lot more—than the 10-year treasury and 30-year mortgage rate. And two, mortgage rates usually but not always rise by more than the 10-year treasury rate.
The fact that all rates don’t rise by at least as much as Fed funds may seem strange. The reason lies with investor expectations for future interest rates and growth. If investors believe that Fed hikes will slow growth or inflation, they be willing to settle for lower interest rates on longer-term securities like the 10-year treasury bond. And because the 30-year mortgage rate is tied to the 10-year treasury bond, its yield rises by less than Fed funds too. So, while Fed tightenings work on demand through bank borrowing rates, their effect on longer-term rates varies and is hard to predict. Expectations play a critical role, both in the determination of longer-term rates and of inflation itself.
The Fed’s job is hard
The Fed controls inflation only indirectly. Using its target interest rate, it influences borrowing costs. And by influencing borrowing costs, it affects demand by consumers and businesses. When demand falls, wages and prices soften, leading to falling inflation. But workers and businesses may refuse to accept lower wages and prices, allowing inflation to persist even in the face of Fed rate hikes, making inflation expectations important. At the same time, Fed tightenings affect different interest rates in different ways. These factors complicate the Fed’s job, making it difficult to predict the timing and precise effect of Fed actions.
Footnotes:
1 Blinder, A. (2023). Landings, Soft and Hard: The Federal Reserve: 1965-2022. The Journal of Economic Perspectives, 37(1), 101-120.
Stock Returns Over the Short and Long Term
Investors saving for retirement typically allocate to stocks, bonds, cash—and perhaps other assets. Deciding how much to invest in each requires an estimate of how much they will grow over time: the higher the expected growth (return), the less you need to invest today to reach your goal. [1]
Stocks are the growth engine of most long-term investment portfolios because they have returned, and are generally expected to return, more than bonds and cash. But they don’t deliver those returns smoothly. And that makes estimating stock performance tricky. It’s tempting to use history as a guide to returns, but this can lead investors astray, especially in the short term.
The historical performance of stocks and bonds
Consider the broadest possible proxy for US equities, the “Wilshire 5000 index” of publicly traded companies (stocks). [2] Since its inception in 1970, stocks have grown over 200-fold, an average annual return of 11.3%. [3] But returns have been erratic.
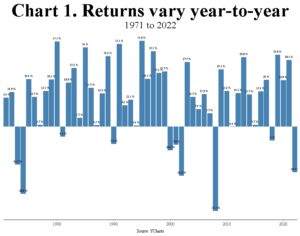
Chart 1 shows the total return of stocks every year since the Wilshire 5000’s inception. In ten of 52 years index returns were less than zero, with an average of negative 14.4%. In the remaining years, they were positive with an average of 18.3%.
Yes, stocks have delivered strong annual returns since inception. But in any given year, all bets are off. Averages can be deceptive.
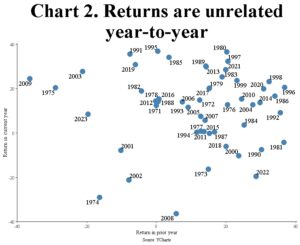
Another way to show the danger of using recent performance to estimate future performance is by comparing back-to-back annual returns. Chart 2 plots stock returns in one year against their returns in the previous year. Each point in the chart is a combination of the return in one year (labeled) and the return in the year before. Notice that the overall cloud of points has no shape—the dots are scattered randomly. This is because returns are unrelated (uncorrelated) from year to year. The immediate past can’t be used to predict the immediate future.
But what about using long-term past returns as a guide to long-term future returns? At first blush, it may seem sensible to assume that, if the structure of the economy doesn’t change, neither will long-run stock returns. The trouble with that logic is that stocks are risky, and in some sense the returns investors have experienced historically were the result of luck.
Measuring the risk of stocks
Chart 1 showed that the stock returns have a wide range. We call this range “volatility,” or simply “risk.” And we put a number on risk using the spread of returns around their average. This deviation (“standard deviation”) gives us a sense for just how risky stocks are. The standard deviation of stocks is approximately 17 percentage points. Thus, most of the time (about 67%) stocks return between negative 6% and positive 28%—a large spread indeed. Losses greater than 28% are unlikely, but they’ve happened.
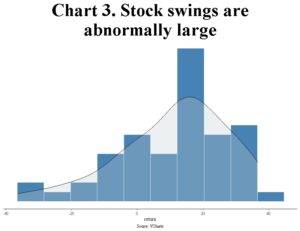
In fact, large losses are more likely than suggested by conventional risk measures like standard deviation. This is because stock returns have a negative skew—a slight tendency to exhibit large returns that are somewhat biased to the downside.
Chart 3 shows the distribution of stock returns (the bars that look like buildings), with an ideal or “normal” distribution draped over it (the transparent mountain shape in front of the bars). The mountain has a long tail on the left. This is evidence of skew. And skew means that large, negative surprises have befallen stocks from time to time. The fact that their cumulative effect wasn’t more harmful was, to a degree, just a matter of luck.
Skew and standard deviation make stock returns hard to predict using long- term history, just as absence of correlation from one year to the next makes stock returns hard to predict using their short-term history. Assuming that stocks will return their historical average (about 11%) ignores the possibility that the past might have been very different but for a few lucky breaks.
A fundamental estimate of stock returns
Short-term stock returns are hard to predict, and long-term historical average returns can mislead investors. But there are other ways to estimate stock returns. The most popular is to assume that the market returns its dividend and other cash companies pay out to investors (e.g., through buybacks) plus growth in earnings over time plus any change in the value that investors attach to those earnings (the “earnings multiple”).
This “fundamental” approach to return forecasting is straightforward and gives reasonable guesses. For example, the current dividend yield on the broad market S&P 500 index is about 1.6%. Trend economic growth, which earnings track, is about 2%. Assuming, for simplicity, no buybacks, no change in the earnings multiple, and that earnings grow at the same rate as the economy, this approach yields a return of roughly 4% for stocks before inflation. If inflation averages 3 to 4% over the forecast horizon, that results in an expected return of about 7 to 8% for stocks. While this sounds low relative to historical average returns, it’s in line with stock performance prior to the internet bubble and would have been most peoples’ guess of what to expect from stocks up to that point.
Set your expectations using a number of methods
Stock returns have no memory—there’s no relation between one year’s performance and the next. And longer-term historical returns are probably too high, given stocks’ potential for large losses and the role that luck has played in avoiding worst case outcomes. Fundamental estimates, though they seem conservative, have the virtue of relying on known sources of return and generating guesses in line with pre-bubble-era experience. Investors should consider both the past and the future when forming their expectations.
Footnotes:
1 Using the “rule of 72,” if an asset returns 7.2% each year, it will double in value in 10 years. Conversely if it grows 10% each year, it will double in a little over 7 years.
2 For a description of the FT Wilshire 5000 see: https://assets-global.website-files.com/60f8038183eb84c40e8c14e9/63c80a401f67aabbeb5fad62_FT_Wilshire_5000_Index_Series_Factsheet_Dec_2022.pdf
3 YCharts is the source of asset returns used in this article.
Should an investor use active or passive management?
This is a common question. It’s also the wrong question. While they have important differences, both active and passive management styles may have a role in an investment portfolio.
Defining active and passive management
Passive (or “index”) management involves owning stocks or bonds (securities) in proportion to their size. The S&P 500 index of US companies, a benchmark or reference point for the performance of the US stock market, consists of 500 publicly traded, leading US companies according to their size. Apple, Microsoft, and Amazon are the three biggest companies in the index when measured by the total value of stock outstanding. Therefore, they’re the three largest holdings in the S&P 500 index—at 6.6%, 5.8%, and 2.6%, respectively. [1] Similarly, the Russell 1000 index of US companies owns the 1000 largest public companies in the US starting with, again, Apple, Microsoft, and Amazon. There are also mid-sized, small-sized, international, and many other types of stock index funds. Bond index funds work the same way as stock index funds with some technical differences owing to the structure of fixed income markets. Passive funds are therefore a way for an investor to own “the market.”
In contrast to passive management, active management involves owning securities not in proportion to their size but based on the decisions of an active manager. An active manager may believe, for example, that Apple is likely to outperform other large, US companies. In this case, they may decide to “overweight” Apple relative to, say, the S&P 500 index by allocating more than 6.6% (the index weight discussed above) of their portfolio to it. That is, an active manager overweights and underweights securities relative to an index in an attempt to outperform that index. Active funds are a way for an investor to potentially outperform the market.
Active and passive manager fees
While their jobs are different, both active and passive managers charge management fees as a percentage of assets under management. These fees (or expenses) are deducted from gross performance, and thus detract from performance—the higher the fee, the higher the hurdle a manager must overcome to deliver positive returns. Fees for a passive manager can range from a few hundredths of a percent to 0.5% or slightly more, depending on the investment type. Active manager fees are typically much higher and vary widely with investment type and management style.
Why it’s hard to beat the market
Last year was a rough one for US stocks: the broad Russell 1000 index of large US companies fell over 19% in 2022. [2] An investor holding a Russell 1000 index fund therefore lost this much, plus the manager’s fee. Active managers who buy large US companies, however, did better on average: about 55% outperformed the S&P 500 index [3]. While they also lost money, they lost less, on average. But 2022 was unusual; typically, a much smaller fraction of active managers underperform their benchmark index. In the 15 years ending in 2022, for example, nearly 90% of active managers underperformed the S&P 500 index. [4]
Active management is hard for many reasons. But they can be summed up with one, simple insight: for every investor who underweights a stock, another investor must overweight it. This is the case because every stock must ultimately be held by someone. Therefore, one active investor’s gains come at the expense of another’s losses. On average, active investors make nothing before fees, and deliver negative returns after fees!
Some feel as if the pros can make money at the expense of amateur day traders; but the low percentage of long-term outperformers cited above suggests that this isn’t easy in practice. To succeed, an active manager must possess skill. Unfortunately, identifying a skilled active manager in advance is almost as hard as being a successful active manager.
But for the lucky or skilled few, active management can deliver returns in excess of the market. This can make it easier for an investor to reach their goals, since higher returns mean higher balances for the same amount of savings. For this reason, some investors may benefit from using both passive and active management.
Active management is hard and expensive, but worth it for some
A passive fund investor owns “the market” and gets the return on the market, less fund expenses. An active fund investor hopes the fund manager will outperform the market—but in reality, most underperform after fees. Some investors need to shoot for the excess returns that an active manager hopes to achieve, however, since expected market (passive) returns aren’t enough to reach their goals. Some investors need both passive and active management.
Footnotes:
1 Source: YCharts.
2 Ibid.
3 https://www.bloomberg.com/news/articles/2023-02-02/s-p-500-index-funds-outperformed-by-stockpickers-in-2022
4 https://www.spglobal.com/spdji/en/research-insights/spiva/
Delivered to your inbox.
We aim to release two newsletters a month, one focused on financial planning and another on investing. If you are interested in having our monthly newsletters delivered directly to your email inbox, choose what topic you prefer and submit this form. Thank you for your interest in our newsletters.
Our mailing address is:
144 Gould Street, Suite 210
Needham, MA 02494
The opinions and forecasts expressed are those of the author, and may not actually come to pass. This information is subject to change at any time, based on market and other conditions and should not be construed as a recommendation of any specific security or investment plan. Past performance does not guarantee future results.
Armstrong Advisory Group, Inc. does not offer tax or legal advice and no portion of this communication should be interpreted as legal or accounting advice. You are strongly encouraged to seek advice from qualified tax and/or legal experts regarding any tax or legal matters relevant to you.
ARMSTRONG ADVISORY GROUP, INC. – SEC REGISTERED INVESTMENT ADVISER
The information contained herein, including any expression of opinion, has been obtained from or is based upon, sources believed to be reliable, but is not guaranteed as to accuracy or completeness. This is not intended to be an offer to buy, sell or hold or a solicitation of an offer to buy, hold or sell the securities, if any referred to herein.
All investments involve the risk of potential investment losses. An investor cannot invest directly in an index. Diversification seeks to reduce the volatility of a portfolio by investing in a variety of asset classes. Neither asset allocation nor diversification guarantees against market loss or greater or more consistent returns. Bonds are subject to interest rate risk and if sold or redeemed prior to maturity, may be subject to additional gain or loss. Armstrong Advisory does not provide any tax or legal advice; please consult with your tax and legal advisers on such matters.

